
|
Alyz Solutions
|
|
Generating Graphs with Rpy
|
|
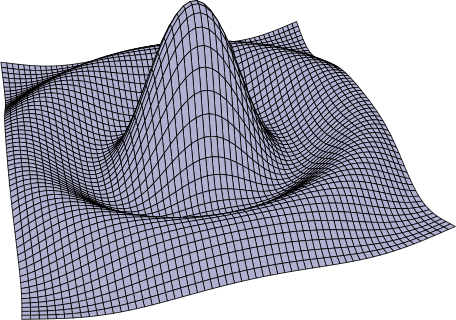
The image above was generated using R along with Rpy in order to use the R interpreter from Python. The python source code that generated the image was adapted from the persp example provided with the basic R installation:
from rpy import *

x = r.seq(-10, 10, length=60)
y = r.seq(-8, 8, length=60)
f = r('function(x,y) { r <- sqrt(x^2+y^2); sin(r)/r }')
z = r.outer(x, y, f)
r.persp(x, y, z, theta = -15,  phi = 35, expand = 0.5,
    col="#b0b0d0", axes=False, box=False)
For more examples of Rpy graphics, see Generating Graphs and Charts with Rpy2.